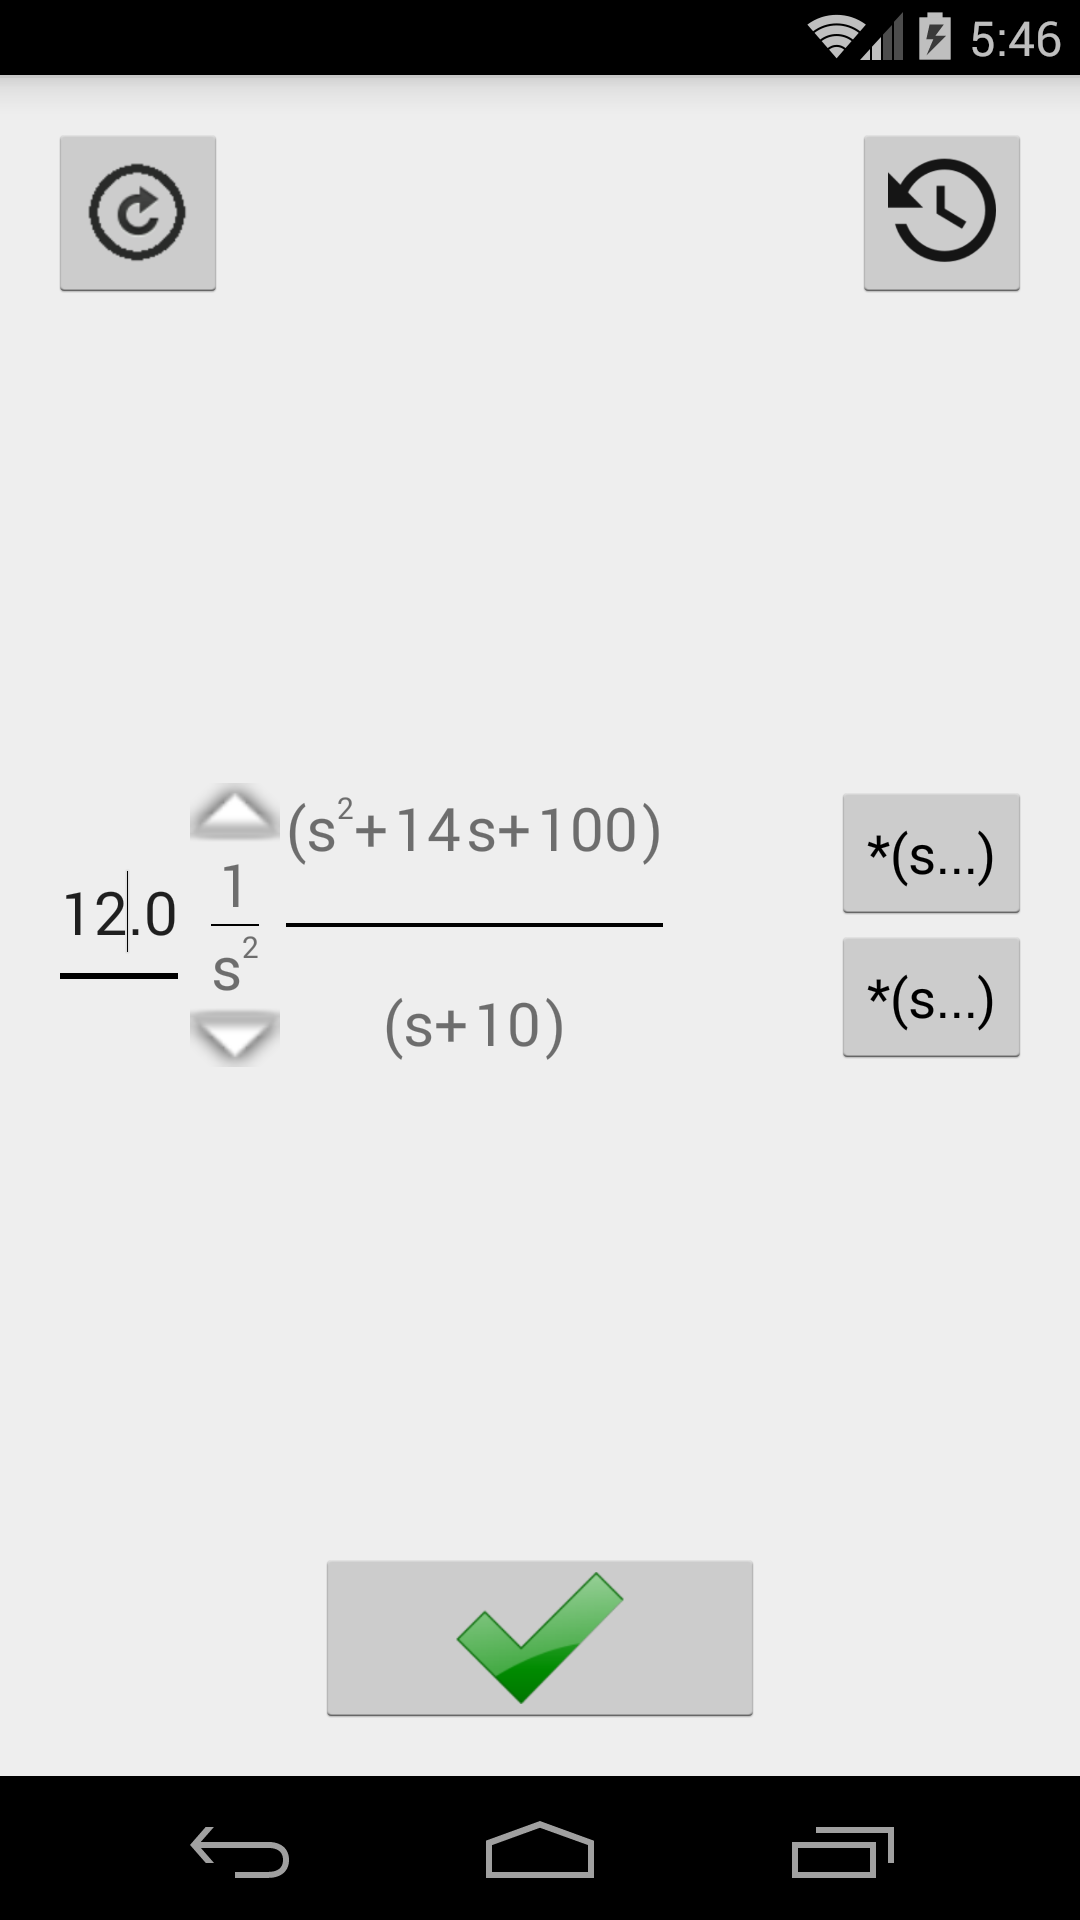
Draws the Bode plot for the entered transfer function.
advertisement
| Name | Bode Plot |
|---|---|
| Version | 4.6 |
| Update | Aug 14, 2021 |
| Size | 2 MB |
| Category | Education |
| Installs | 10K+ |
| Developer | Jukic Hrvoje |
| Android OS | Android 4.0+ |
| Google Play ID | com.hrca.bode.bodediagram |
Bode Plot · Screenshots


Bode Plot · Description
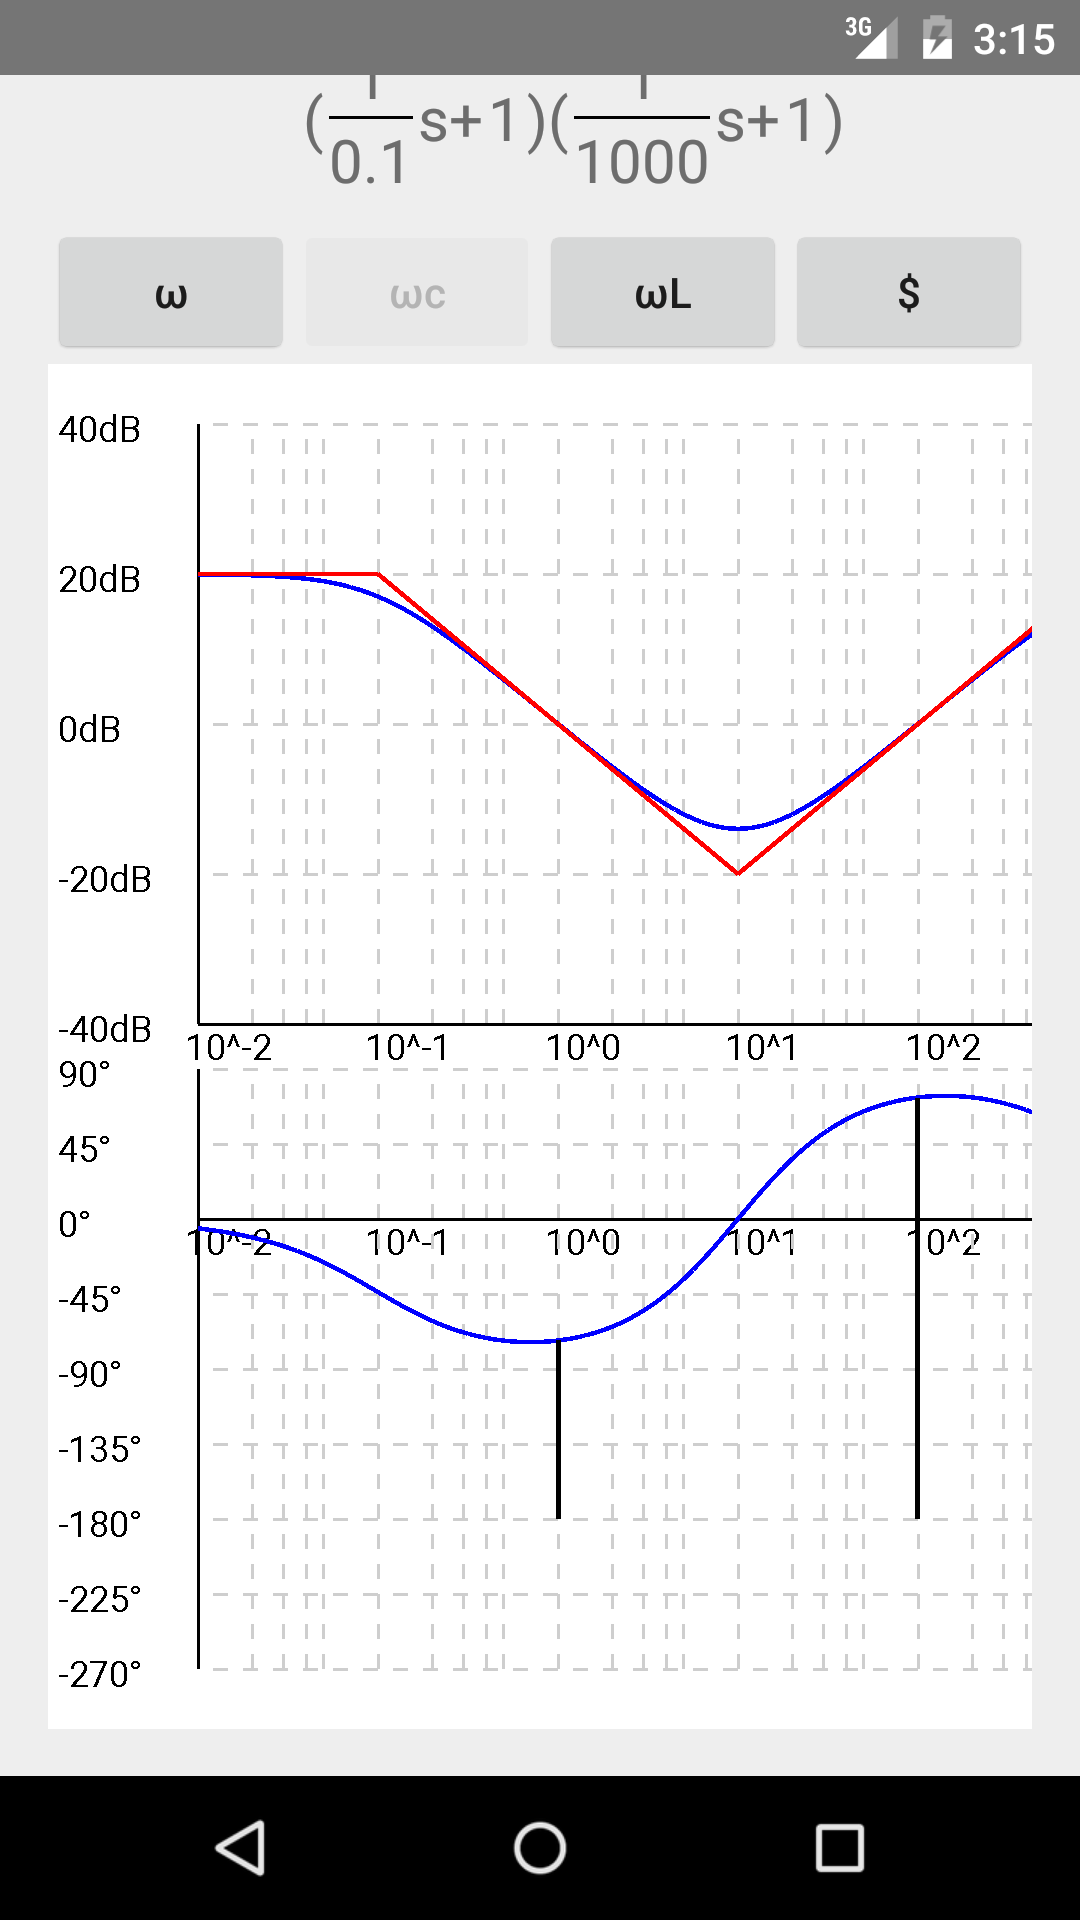
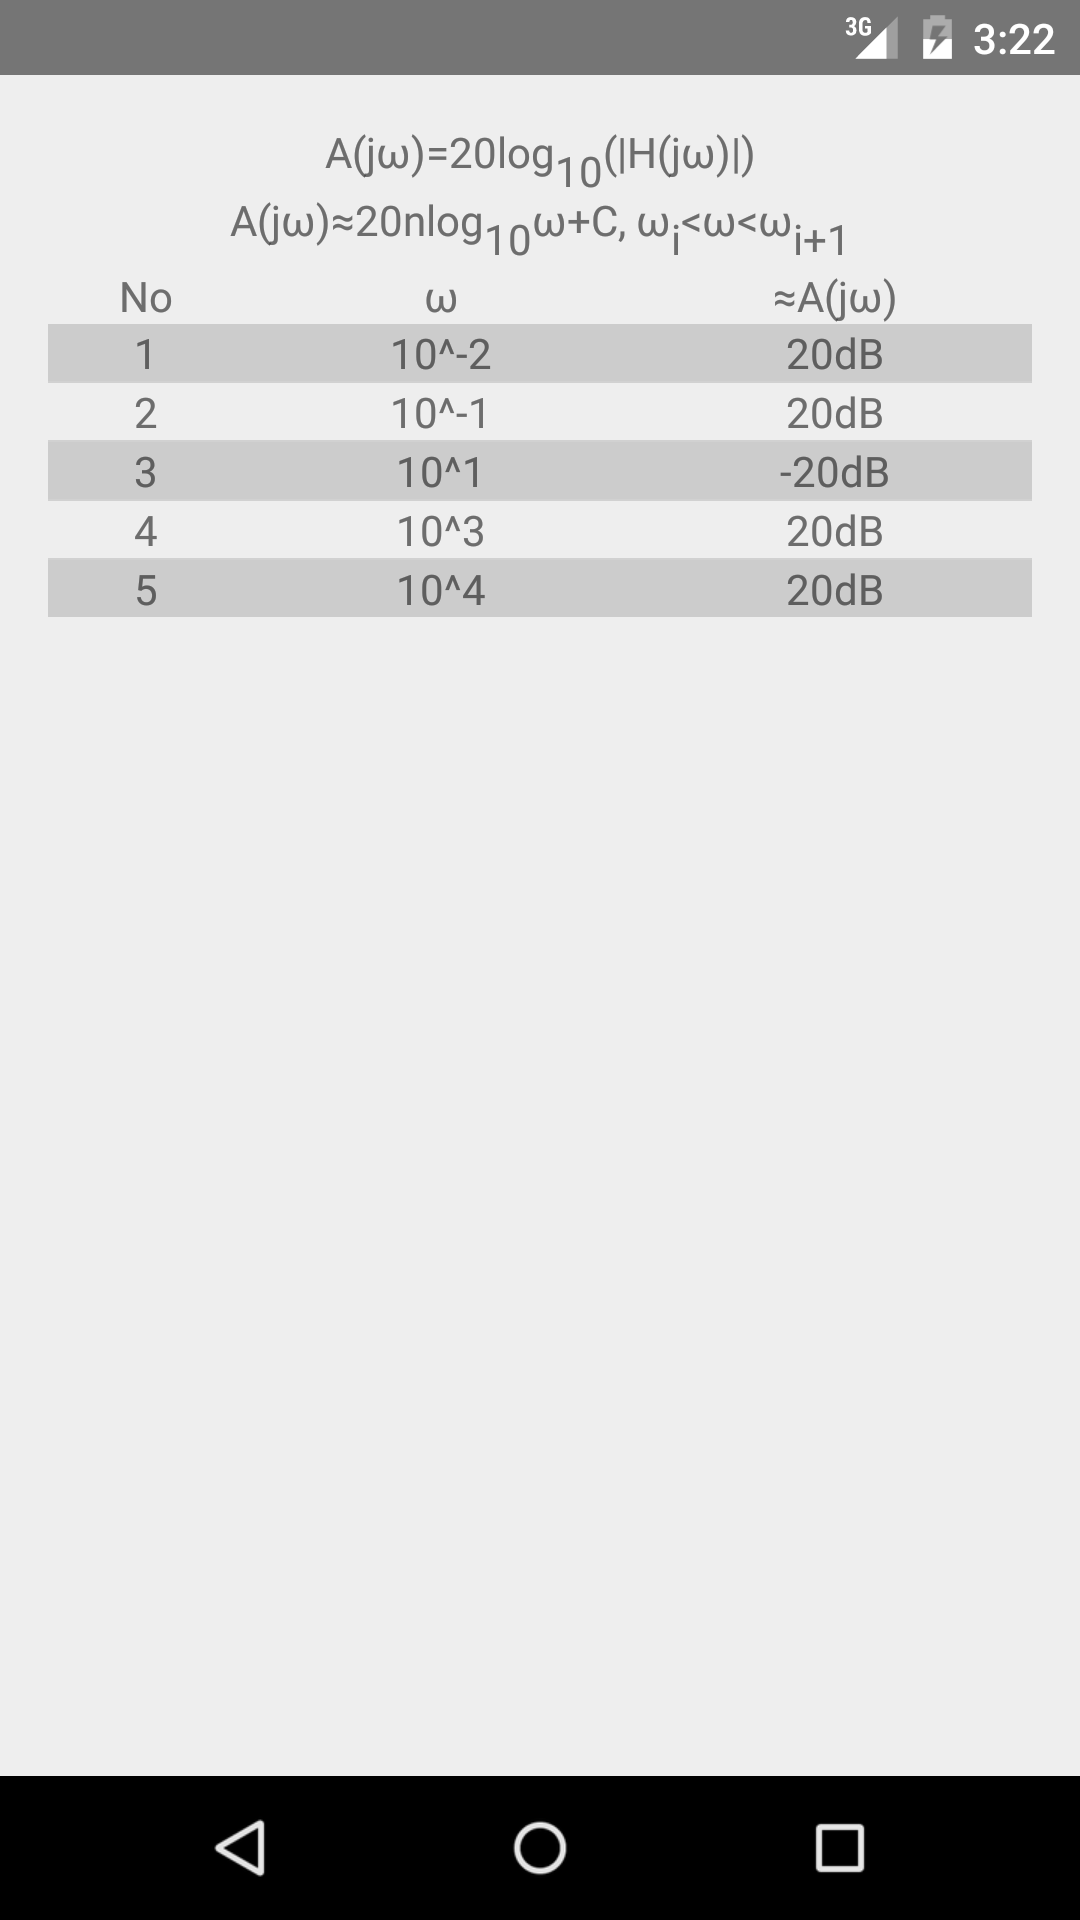
The Bode plot is a graph of the frequency response of a system. It is the combination of a Bode magnitude plot, expressing the magnitude of the frequency response (decibels), and a Bode phase plot, expressing the phase shift (degrees). Both quantities are plotted against a horizontal axis proportional to the logarithm of frequency.
The Bode plot is used in electrical engineering and control theory.
The phase shift is limited in an interval from -270° to +90°.
Phase and gain margins.
The app also contains a history of the 10 most recently used transfer functions.
No advertisement.
The Bode plot is used in electrical engineering and control theory.
The phase shift is limited in an interval from -270° to +90°.
Phase and gain margins.
The app also contains a history of the 10 most recently used transfer functions.
No advertisement.